In this article I will explain with an example how to populate a chart control from sql server database using entity framework in windows application.
Database:
Here I am using Northwind database. You can download it from following link.
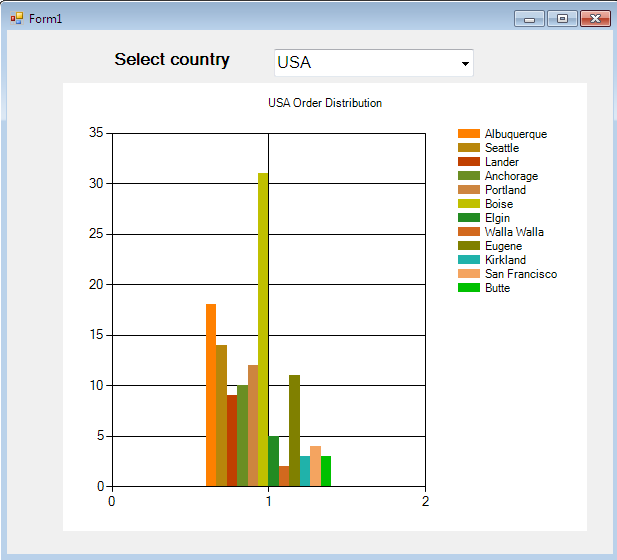
You can view the chart based on the combo box selection dynamically populated from database. In the combobox I loaded list countries where the orders have been shipped. The chart will present the information, x axis represents the cities of the countries having orders and y-axis represents the total amount of orders shiped throughout the each city.
  public partial class Form1 : Form
    {
       private models db = new models();
        public Form1()
        {
           InitializeComponent();
           LoadCountries();
           cboCountry.SelectedIndex =2;
           Displaychart(cboCountry.Text);
        }

        private void LoadCountries()
        {
            var countries = (from c in db.Orders
                             select new { c.ShipCountry }).Distinct().ToList();
           cboCountry.DataSource = countries;
           cboCountry.ValueMember = "shipcountry";
           cboCountry.DisplayMember = "shipcountry";
        }

        public void Displaychart(string country) {

            var result = from queryResult in db.Orders.AsEnumerable()
                         where queryResult.ShipCountry ==country
                                group queryResult by queryResult.ShipCity into rowGroup
                                select new
                                {
                                    Name =rowGroup.Key,
                                    OrdersCount= rowGroup.Count()
                                };

            // Set palette
            this.chartControl.Palette = ChartColorPalette.EarthTones;
            // Set title
            this.chartControl.Titles.Clear();
            this.chartControl.Titles.Add(string.Format("{0} Order Distribution", country));
            this.chartControl.Series.Clear();

            foreach (var i in result)
            {
                Series series = this.chartControl.Series.Add(i.Name);
               series.Points.Add(i.OrdersCount);
            }

        }

        private void cboCountry_SelectedIndexChanged(object sender, EventArgs e)
        {
           Displaychart(cboCountry.Text);

        }    }
Output: