In this article I will show you how to create 5 canvas charts from database in asp.net MVC c# implemented using chart.js.
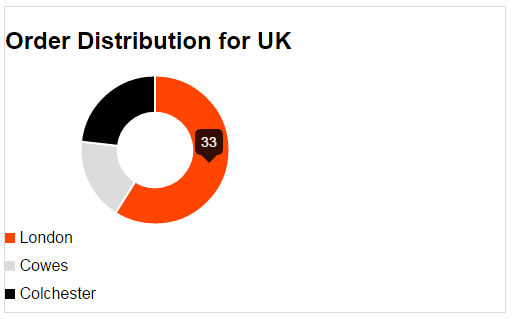
The chart will display the order statics of the country UK where the orders have been shipped. The jQuery ajax post call to a controller function GetData() and result the json response and bind the data in the chart using HTML canvas.
Database:
Here I am using Northwind database. You can download it from following link.
Open Microsoft sql management studio and right click on the database and attach it.
Step 1: Create an ado.net entity data model using table orders and generate entity for that.
Step 2: Right click on the "Controllers" folder and add "Chart" controller. Copy and paste the following code.
public class ChartController : Controller
    {
        // GET: /Chart/
        public ActionResult Index()
        {
            return View();
        }

        public ActionResult GetData()
        {
            models db = new models();
            var query = from queryResult in db.Orders.AsEnumerable()
                        where queryResult.ShipCountry == "UK"
                        group queryResult by queryResult.ShipCity into rowGroup
                        select new
                        {
                            Name = rowGroup.Key,
                            OrdersCount = rowGroup.Count()
                        };

            List<Shiping> List = new List<Shiping>();

            int i = 0;
            foreach (var row in query)
            {
                Shiping ship = new Shiping();
                ship.Name = row.Name;
                ship.value = row.OrdersCount;
                System.Threading.Thread.Sleep(500);

                Random randomGen = new Random();
                KnownColor[] names = (KnownColor[])Enum.GetValues(typeof(KnownColor));
                KnownColor randomColorName = names[randomGen.Next(names.Length)];
                Color randomColor = Color.FromKnownColor(randomColorName);

                ship.color = randomColor.Name;

                List.Add(ship);
                i++;
            }
            string output = JsonConvert.SerializeObject(List);
            return new JsonResult
            {
                Data = new
                {
                    success = output,
                    message = "Success",
                },
                JsonRequestBehavior = JsonRequestBehavior.AllowGet
            };

        }

    }
Step 3: Right click on the "Index" action method in the "ChartController" and add "Index" view. Copy and paste the following code.
<html>
<head>
    <meta name="viewport" content="width=device-width" />
    <title>Order Distribution for UK</title>
    <script type="text/javascript" src="http://ajax.googleapis.com/ajax/libs/jquery/1.8.3/jquery.min.js"></script>
    <script src="//cdnjs.cloudflare.com/ajax/libs/Chart.js/1.0.2/Chart.js" type="text/javascript"></script>
    <script type="text/javascript">
        $(function () {
                $.ajax({
                type: 'POST',
                url: "@Url.Action("GetData", "Chart", new { area = "" })",
                data: {},
                success: function (data) {
                    LoadChart(data.success);
                }
            });

          });
        function LoadChart(data) {
            $("#myChart").html("");

            var el = document.createElement('canvas');
            $("#myChart")[0].appendChild(el);

           //Fix for IE 8
           if ($.browser.msie && $.browser.version == "8.0") {
                G_vmlCanvasManager.initElement(el);
            }
            var ctx = el.getContext('2d');
            var json = $.parseJSON(data);
            var chart = new Chart(ctx).Doughnut(json);


            if (data != null) {

                for (var i = 0; i < json.length; i++) {
                    var div = $("<div />");
                    div.css("margin-bottom", "10px");
                    div.html("<span style = 'display:inline-block;height:10px;width:10px;background-color:" + json[i].color + "'></span> " + json[i].Name);
                    $("#myChart").append(div);
                }

            }
        }

    </script>
</head>
<body style="border: 1px solid #DED8D8; width: 500px; height: 305px; font-family: Arial;">
    <div>
        <h2>Order Distribution for UK</h2>
        <table border="0" cellpadding="0" cellspacing="0">
            <tr>
                <td>
                    <div id="myChart">
                    </div>
                </td>
            </tr>
        </table>
    </div>
    </body>
</html>
Output: