
In this article we will discuss how to create a chart using jQuery. The first step we should download chart.js or use the jQuery cdn, just reference the file in the script tag of the page.
We are ready to create our first chart by creating an json objects, each object contain several properties such as color, value label etc. we need to get the 2d context of the canvas and create a droughnut chart by pass the object parameters.
Example:
<html>
<head>
<meta name="viewport" content="width=device-width" />
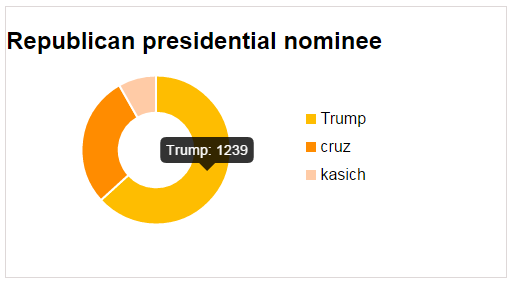
<title>Republican presidential nominee</title>
<script type="text/javascript" src="http://ajax.googleapis.com/ajax/libs/jquery/1.8.3/jquery.min.js"></script>
<script src="//cdnjs.cloudflare.com/ajax/libs/Chart.js/1.0.2/Chart.js" type="text/javascript"></script>
<script type="text/javascript">
$(function () {
LoadChart();
});
function LoadChart() {
$("#myChart").html("");
$("#dvLegend").html("");
var candidates = new Array();
var trump = {};
trump.label = "Trump";
trump.value = 1239;
trump.color = "#FEBD01";
candidates.push(trump);
var cruz = {};
cruz.label = "cruz";
cruz.value = 559;
cruz.color = "#FF8C00";
candidates.push(cruz);
var kasich = {};
kasich.label = "kasich";
kasich.value = 161;
kasich.color = "#FFCBA6";
candidates.push(kasich);
var el = document.createElement('canvas');
$("#myChart")[0].appendChild(el);
//Fix for IE 8
if ($.browser.msie && $.browser.version == "8.0") {
G_vmlCanvasManager.initElement(el);
}
var ctx = el.getContext('2d');
var chart = new Chart(ctx).Doughnut(candidates);
for (var i = 0; i <candidates.length; i++) {
var div = $("<div />");
div.css("margin-bottom", "10px");
div.html("<spanstyle = 'display:inline-block;height:10px;width:10px;background-color:" + candidates[i].color + "'></span> " + candidates[i].label);
$("#dvLegend").append(div);
}
}
</script>
</head>
<body style="border: 1px solid #DED8D8; width: 500px; height: 270px; font-family: Arial;">
<div>
<h2>Republicanpresidential nominee</h2>
<table border="0" cellpadding="0" cellspacing="0">
<tr>
<td>
<div id="myChart">
</div>
</td>
<td>
<div id="dvLegend">
</div>
</td>
</tr>
</table>
</div>
</body>
</html>
Output:
Post your comments / questions
Recent Article
- How to create custom 404 error page in Django?
- Requested setting INSTALLED_APPS, but settings are not configured. You must either define..
- ValueError:All arrays must be of the same length - Python
- Check hostname requires server hostname - SOLVED
- How to restrict access to the page Access only for logged user in Django
- Migration admin.0001_initial is applied before its dependency admin.0001_initial on database default
- Add or change a related_name argument to the definition for 'auth.User.groups' or 'DriverUser.groups'. -Django ERROR
- Addition of two numbers in django python
Related Article