
In this article, I will show you how to create google Organizational Structure chart from database using API in asp.net.
I Created a Generic List of objects and adding all the employees of the Organization which resulted from Linq Query records.
The jQuery Ajax post call to a controller function GetChart() and result the json response and bind the data in the chart using jQuery google charts API.
I added three columns for the google visualization datatable such as Entity, ParentEntity and Tooltip. The Entity is to display the Employee name, Destination and picture of the employee. ParentEntiy is the RootNode; if we leave it empty (NULL) it will be considered as parent for ReportingManagerId. Tooltip attribute is used to display Text while mouse hover on the browser.
Database:
In this example I used employeesHierarchy table.
Step 1: Create a table using the following script with data:
CREATE TABLE[dbo].[EmployeesHierarchy](
      [EmployeeId] [int] NOT NULL,
      [Name] [varchar](100) NOT NULL,
      [Designation] [varchar](30) NOT NULL,
      [ReportingManager] [int] NULL,
      [PhotoPath] [nvarchar](255) NULL,
 CONSTRAINT[PK_EmployeesHierarchy] PRIMARY KEY CLUSTERED
(
      [EmployeeId] ASC
)WITH (PAD_INDEX  = OFF, STATISTICS_NORECOMPUTE  = OFF, IGNORE_DUP_KEY = OFF, ALLOW_ROW_LOCKS = ON, ALLOW_PAGE_LOCKS  = ON) ON [PRIMARY]
) ON[PRIMARY]
GO
SET ANSI_PADDINGOFF
GO
INSERT [dbo].[EmployeesHierarchy] ([EmployeeId], [Name],[Designation], [ReportingManager], [PhotoPath]) VALUES (1, N'Nancy Davolio', N'Sales Representative', 5, N'/uploads/Nancy Davolio.png')
INSERT [dbo].[EmployeesHierarchy] ([EmployeeId], [Name],[Designation], [ReportingManager], [PhotoPath]) VALUES (2, N'Andrew Fuller', N'CEO', 3, N'/uploads/Andrew Fuller.png')
INSERT [dbo].[EmployeesHierarchy] ([EmployeeId], [Name],[Designation], [ReportingManager], [PhotoPath]) VALUES (3, N'Janet Leverling', N'Managing Director', NULL, N'/uploads/Janet Leverling.png')
INSERT [dbo].[EmployeesHierarchy] ([EmployeeId], [Name],[Designation], [ReportingManager], [PhotoPath]) VALUES (4, N'Margaret Peacock', N'Sales Representative', 5, N'/uploads/Margaret Peacock.png')
INSERT [dbo].[EmployeesHierarchy] ([EmployeeId], [Name],[Designation], [ReportingManager], [PhotoPath]) VALUES (5, N'Steven Buchanan', N'Sales Manager', 2, N'/uploads/Steven Buchanan.png')
INSERT [dbo].[EmployeesHierarchy] ([EmployeeId], [Name],[Designation], [ReportingManager], [PhotoPath]) VALUES (6, N'Michael Suyama', N'Sales Representative', 8, N'/uploads/Michael Suyama.png')
INSERT [dbo].[EmployeesHierarchy] ([EmployeeId], [Name],[Designation], [ReportingManager], [PhotoPath]) VALUES (7, N'Robert King', N'Sales Representative', 8, N'/uploads/Robert King.png')
INSERT [dbo].[EmployeesHierarchy] ([EmployeeId], [Name],[Designation], [ReportingManager], [PhotoPath]) VALUES (8, N'Laura Callahan', N'Sales Manager', 2, N'/uploads/Laura Callahan.png')
INSERT [dbo].[EmployeesHierarchy] ([EmployeeId], [Name],[Designation], [ReportingManager], [PhotoPath]) VALUES (9, N'Anne Dodsworth', N'Sales Representative', 5, N'/uploads/Anne Dodsworth.png')
Step 2: Create an ado.net entity data model using table EmployeesHierarchy and generate entity for that.
Step 3: Right clicks on the "Controllers" folder and add "OrganizationChart" controller. Copy and paste the following code.
  public class OrganizationController : Controller
    {
       models db = new models();
        public ActionResult Index()
        {
            return View();
        }

        public ActionResult GetChart(string country)
        {
            List<object>chartData = new List<object>();
           chartData.Add(new object[]{
                "EmployeeId", "Name", "Designation", "ReportingManager", "PhotoPath"
            });

            var result = (from emp indb.EmployeesHierarchies.AsEnumerable()
                          select new
                          {
                              EmployeeId =emp.EmployeeId,
                              Name = emp.Name,
                              Designation =emp.Designation,
                              ReportingManager= emp.ReportingManager,
                              PhotoPath =emp.PhotoPath,
                         }).Distinct().ToList();

            foreach (var c in result)
            {
               chartData.Add(new object[]
                   {
                       c.EmployeeId, c.Name,c.Designation, c.ReportingManager,c.PhotoPath
                   });
            }

            return new JsonResult
            {
                Data = new
               {
                   success = chartData,
                   message = "Success",
               },
               JsonRequestBehavior = JsonRequestBehavior.AllowGet
            };

        }

    }
Step 4: Right click on the "Index" action method in the "OrganizationController" and add "Index" view. Copy and paste the following code.
@{
   ViewBag.Title = "Create Organizational Chart from Database using Google Api";
}
<h2 style="text-align:center" >Create Organizational Chart fromDatabase using Google Api</h2>
<script src="//code.jquery.com/jquery-1.10.2.js"></script>
<script type="text/javascript" src="https://www.google.com/jsapi"></script>
<script type="text/javascript">
    google.load("visualization", "1", { packages: ["orgchart"] });
    google.setOnLoadCallback(drawChart);
    function drawChart() {
        $.ajax({
           type: "POST",
            url: "@Url.Action("GetChart", "Organization", new { area = "" })",
           data: '{}',
           contentType: "application/json;charset=utf-8",
           dataType: "json",
           success: function (r) {
                var data = new google.visualization.DataTable();
               data.addColumn('string', 'Entity');
               data.addColumn('string', 'ParentEntity');
               data.addColumn('string', 'ToolTip');
                debugger;
                for (var i = 1; i <r.success.length; i++) {
                   debugger;
                   var employeeId =r.success[i][0].toString();
                   var employeeName = r.success[i][1];
                   var designation = r.success[i][2];
                   var reportingManager =r.success[i][3] != null ? r.success[i][3].toString() : '';
                   var photo = r.success[i][4];
                   data.addRows([[{
                       v: employeeId,
                       f: employeeName + "<div>(<span>" + designation + "</span>)</div><imgstyle='width:100px;height:100px' src = '" + photo + "' />"
                   }, reportingManager, designation]]);
               }
                var chart = new google.visualization.OrgChart($("#chart")[0]);
               chart.draw(data, { allowHtml: true });
            },
           failure: function (r) {
               alert(r.d);
            },
           error: function (r) {
               alert(r.d);
            }
        });
    }
</script>
<div id="chart">
</div>
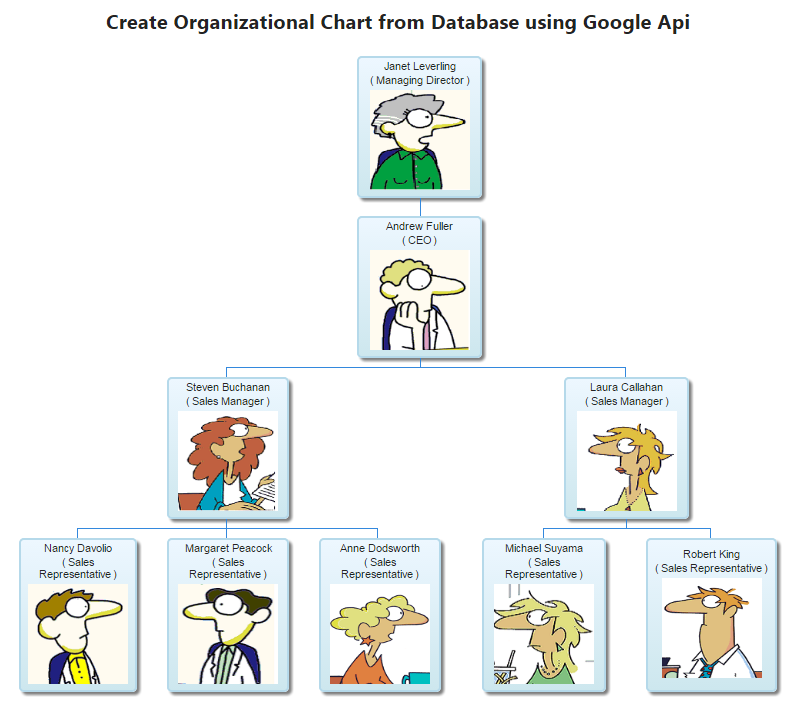
Output:
Post your comments / questions
Recent Article
- How to create custom 404 error page in Django?
- Requested setting INSTALLED_APPS, but settings are not configured. You must either define..
- ValueError:All arrays must be of the same length - Python
- Check hostname requires server hostname - SOLVED
- How to restrict access to the page Access only for logged user in Django
- Migration admin.0001_initial is applied before its dependency admin.0001_initial on database default
- Add or change a related_name argument to the definition for 'auth.User.groups' or 'DriverUser.groups'. -Django ERROR
- Addition of two numbers in django python
Related Article